Create
The development process followed key milestones: model implementation, hardware assembly, embedded software development and server deployment.
FWI Model
I began the project by coding the FWI model, because it could be developed and tested independently of the hardware.
Model Structure
The model consists of the following indices:
- Fine Fuel Moisture Code (FFMC) - Represents moisture content of litter and other fine fuels
- Duff Moisture Code (DMC) - Respresents moisture content of loosely compacted organic material
- Drought Code (DC) - Represents moisure content of deep compact organic material.
- Initial Spread Index (ISI) - Represents fire spread rate
- Buildup Index (BUI) - Represents the total amount of fuel available to the fire
- Fire Weather Index (FWI) - Represents the intensity of a spreading fire
- Daily Severity Rating (DSR) - Represents the difficulty of controlling fires
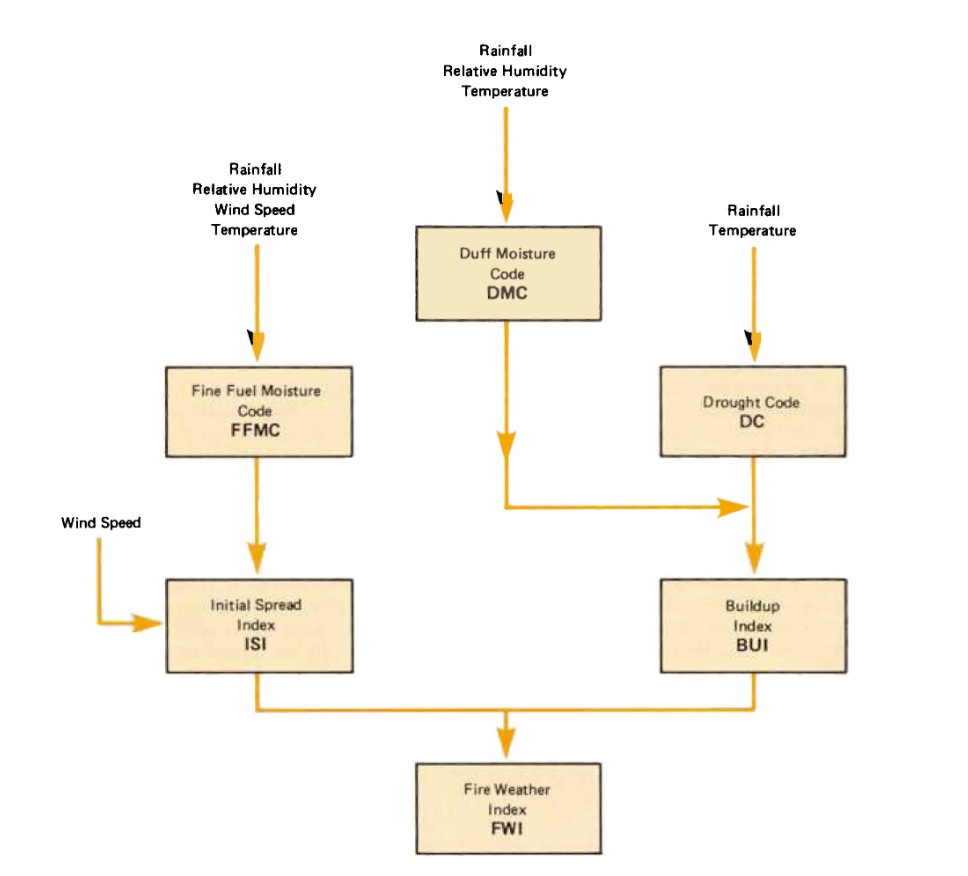
The structure of the model is shown in the flowchart below:
Model Implementation
Because the model contains several indices, I decided to split the calculations into separate files, and to have one file which calls them all.
I programmed the model in Python, because its syntax is compatible with MicroPython, which runs on the Pico.
For the rain and wind data, I decided to use the Met Eireann API, because the collection of rain and wind would add extra complexity and cost to the project.
To program the model, I converted the equations from Equations and FORTRAN Program for the Canadian Forest Fire Weather Index System
by Van Wagner and Pickett, [12]
into Python functions.
Finally, I combined the functions to produce the final FWI values.
To make the programs easier to use and maintain, I wrote documentation for them using Markdown. (This can be found in the modelling folder)
Unit Tests
To test the model code, I converted a data table with calculated results from page 24 of Van Wagner and Pickett to CSV.
I then wrote python scripts to run each function with the given inputs and compare the output to the reference values.
I set the tolerance between my Python code and the expected value, to ± 0.3, because the original table was generated with FORTRAN and the results were rounded differently.
When tested, all of the functions gave outputs within tolerance.
Integration Test
To test that the different functions work together properly, I used the same table as for the unit tests.
I wrote a Python script to execute the model sequentially, with the outputs from each stage used as subsequent inputs.
I used the same tolerances as for the unit tests to compare to the given table.
When tested, the integrated model produced outputs within tolerance across all test cases.
Hardware Assembly
Assembly Process
When the hardware arrived, I began by soldering header pins to the modules.
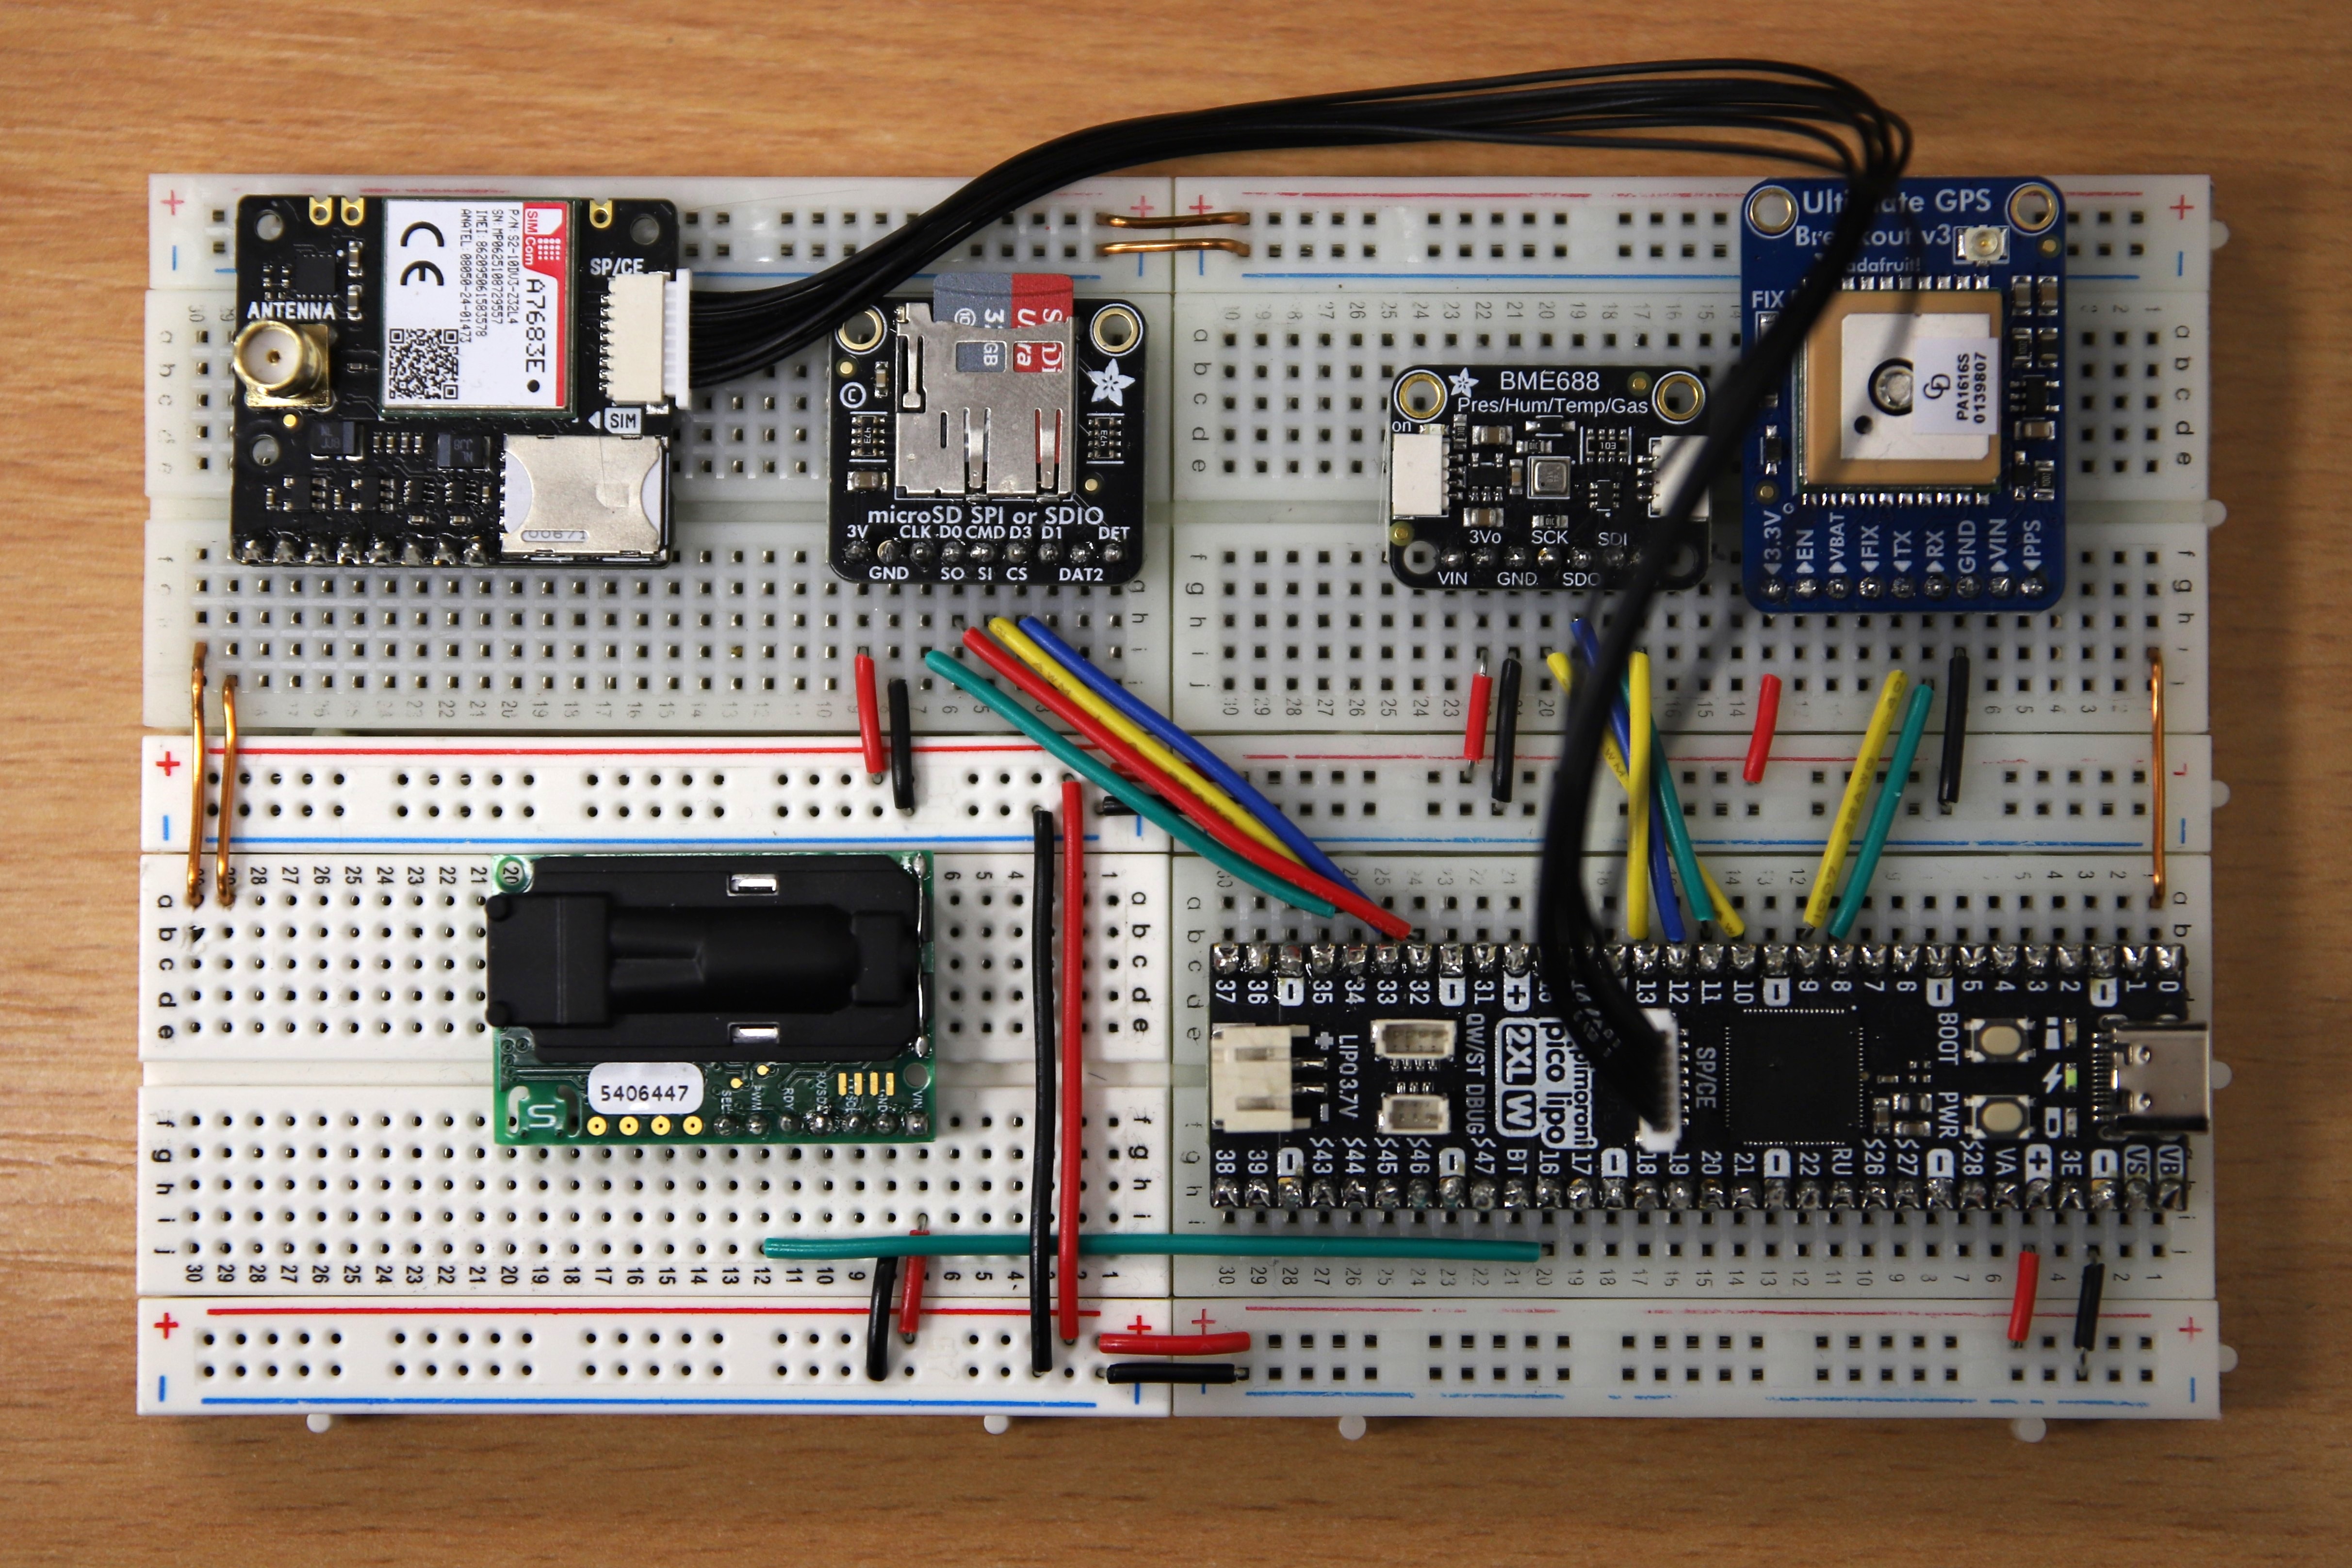
I then assembled the system on multiple breadboards.
An additional feature of the Pimoroni Pico that influenced my component selection was its extra connectivity, including SP/CE and Qw/ST connectors.
Because of this, I chose modules that supported these connectors where possible.
I connected the LTE modem to the Pico using an SP/CE cable provided with the modem.
I initially connected the BME688 using a Qw/ST cable. However, the cable broke after a few days, so I instead connected the sensor using header pins.
As a result, all modules except the LTE modem were connected through header pins on the breadboard.
Interface Connections
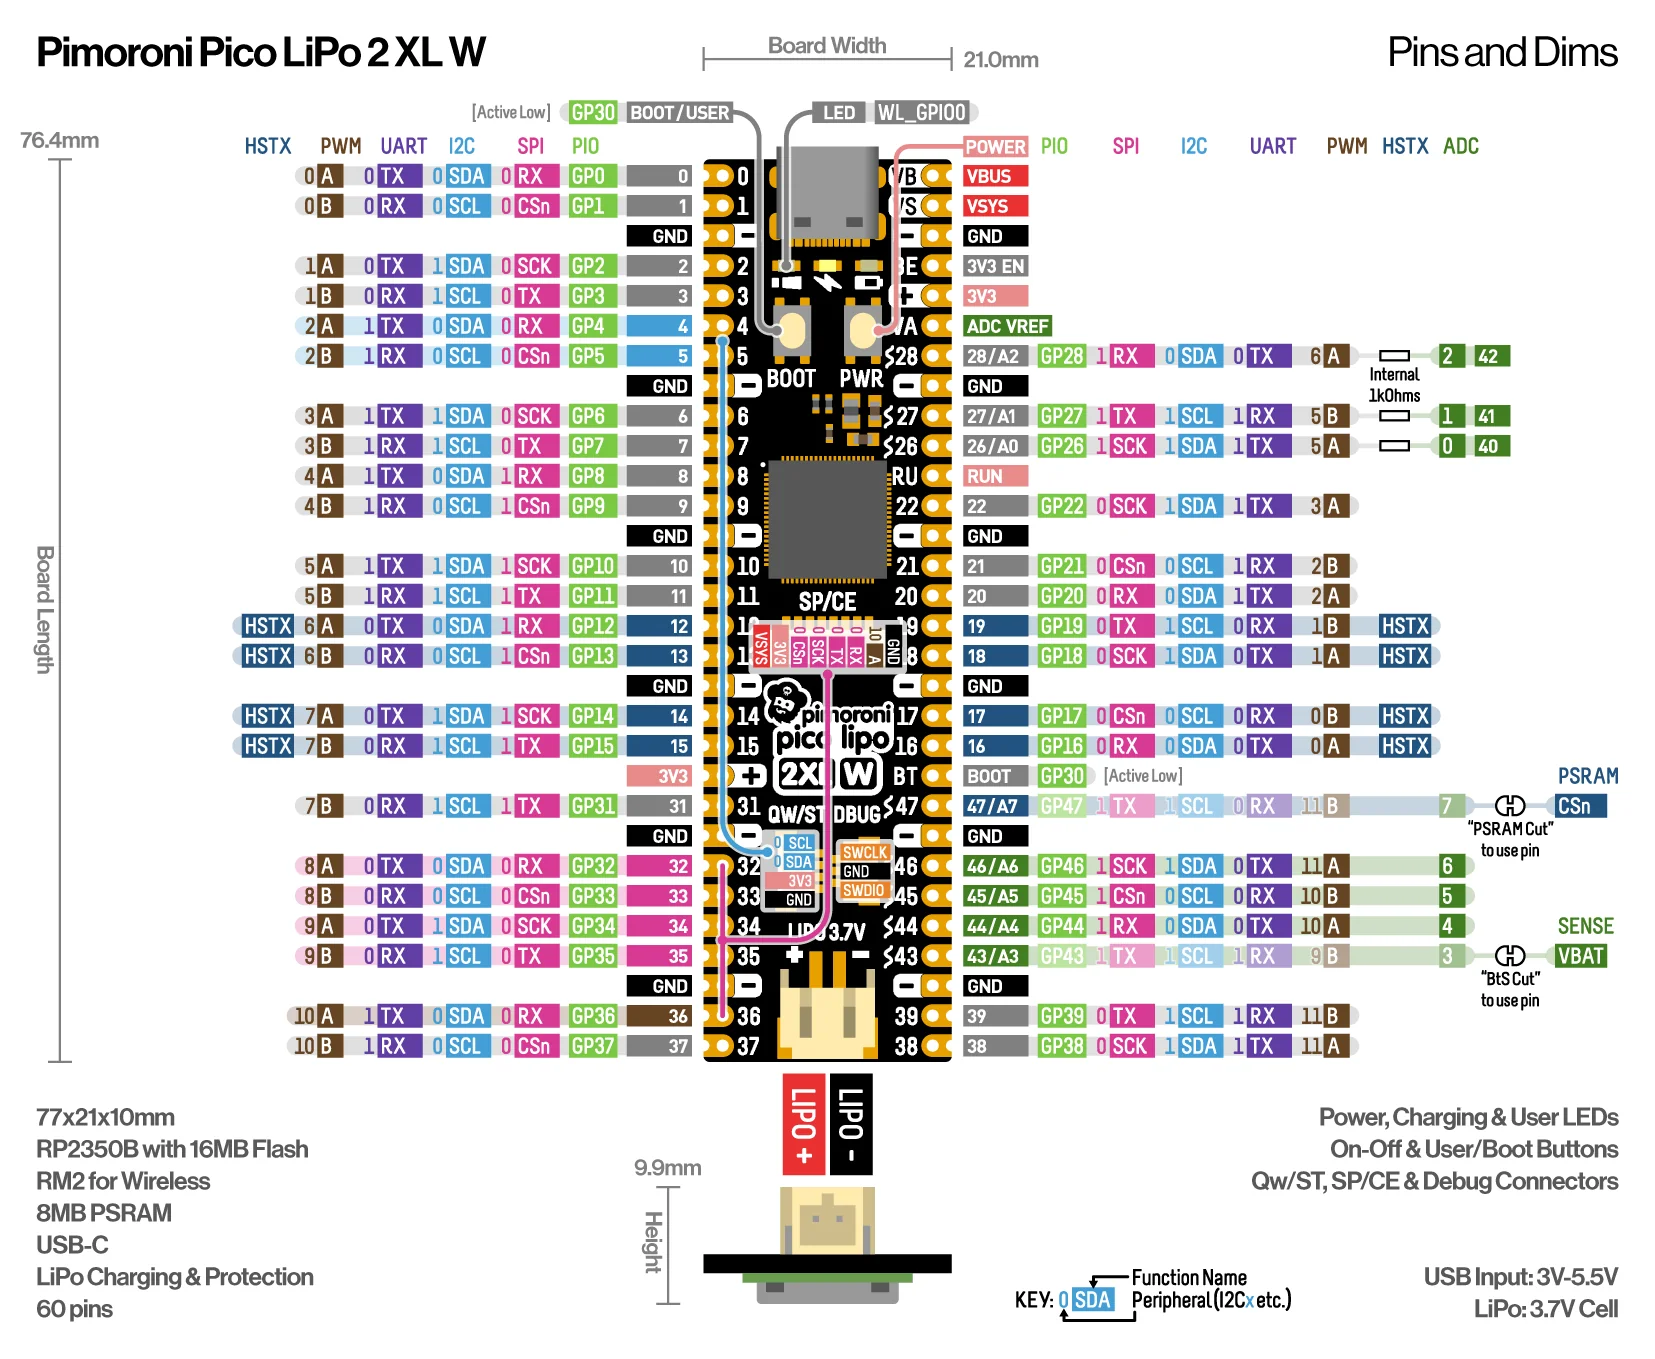
The modules were connected to the Pico using the following interfaces:
| Module | Interface | Pico Pins |
|---|---|---|
| LTE Clipper | UART | UART 0 - (TX GP34, RX GP35) |
| GPS Module | UART | UART 1 - (TX GP8, RX GP9) |
| BME688 Sensor | SPI | SPI 1 - (SCK GP10, MOSI GP11, MISO GP12, CS GP13) |
| SD Card Module | SPI | SPI 0 - (SCK GP32, MOSI GP33, MISO GP34, CS GP35) |
| SCD-30 CO2 Sensor | PWM Output | PWM - (GP16) |
Pico Pinout
Hardware Issues
I noticed that the four breadboards I was using were coming apart. To stabilise them, I tied the breadboards together using copper wire.
I also noticed that the GPS connection was very unrealiable. This is probably because there is no antenna connected, and the integrated antenna is very small.
To fix this, I added a section to my script to initialise the location, the location then gets overwritten once a GPS connection is achieved.
Power and LTE Connectivity
To supply power to the system, I connected the Pico's 3.3V and ground pins to the breadboard rails, and then connected the rails to the modules.
To provide cellular connectivity to the modem, I purchased a SIM card from Lycamobile. I also connected an antenna to the LTE modem to ensure a better connection.
Embedded Software
Once the hardware was assembled, I began developing the embedded software to operate the system.
I installed the Pimoroni MicroPython firmware from their GitHub repository[11]
onto the Pico, which enabled it to run MicroPython code.
I used the Thonny IDE to write and upload code to the Pico, because of its simple interface and built-in serial functionality.
To keep the software organised, I separated the code for each module into individual files containing functions for that component.
I also installed the FWI Model programs and called the functions using sensor inputs.
The main program main.py then imports these functions and calls them.
The modular structure made the code easier to troubleshoot and kept the main program easy to read, with the program logic clearly visible.
While programming the main.py file, I had issues connecting the SD Card module.
As a result, I added an endpoint to the server which returns the previous day's Index values, in order to be able to calculate the new values.
Server
To support the wildfire sensor, I set up a Flask server to receive sensor data and display it publicly.
To run the server, I chose a cloud virtual machine from Hetzner.
The instance used was the CX23, which has two cores, 4 GB of RAM, 40 GB of SSD storage and a 20 TB traffic allowance.
I installed Ubuntu Server on the machine because I had previous experience with the OS.
With the OS installed, I updated the system packages and installed Python3, Flask and SQLite3.
Using Python, Flask and SQLite, I created a script that receives POST requests from the sensor and inserts the data into an SQLite database.
The script then generates and serves a web page with the information. (Web page example available in Server folder)